Canadian Home Sales Weakened Further in November
 Statistics released today by the Canadian Real Estate Association (CREA) show that national home sales dipped for the third consecutive month, down 2.3% from October to November and down a whopping 12.6% year-over-year. Transactions declined in just over half of all local markets, with lower activity in the Greater Toronto Area (GTA), the Greater Vancouver Area (GVA) and Hamilton-Burlington offsetting increased sales in Edmonton. Sales were down from year-ago levels in three-quarters of all local markets, including the Lower Mainland of British Columbia, Calgary, the GTA and Hamilton-Burlington.
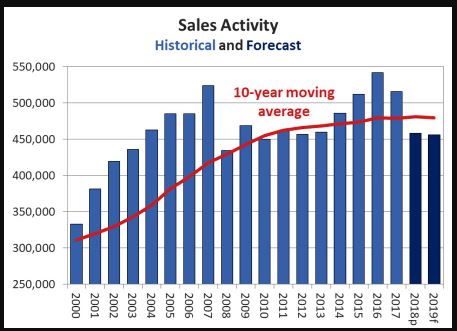
These data suggest a double-digit national sales decline in 2018, falling to its lowest level in five years even though the economy is reaching full employment. Next year’s growth in sales and prices will likely be moderated by recent policy changes from different levels of government, in addition to upward pressure on interest rates.
Many had expected a rebound in sales in British Columbia, but so far it has not materialized. The rebound in sales in Ontario last summer has now run its course and activity in Alberta has edged lower. Housing transactions in Quebec, in contrast, were strong.
New Listings
The number of newly listed homes fell by 3.3% between October and November, with new supply declining in roughly 70% of all local markets.
With new listings having declined by more than sales in November, the national sales-to-new listings ratio tightened slightly to 54.8% compared to 54.2% in October. This measure of market balance has remained close to its long-term average of 53.4% since the beginning of 2018.
Based on a comparison of the sales-to-new listings ratio with the long-term average, about 60% of all local markets were in balanced market territory in November 2018. There were 5.4 months of inventory on a national basis at the end of November 2018. While this remains in line with its long-term average of 5.3 months, the number of months of inventory is well above its long-term average in the Prairie provinces as well as in Newfoundland & Labrador. By contrast, the measure is well below its long-term average in Ontario, New Brunswick and Prince Edward Island. In other provinces, sales and inventory are more balanced.
Home Prices
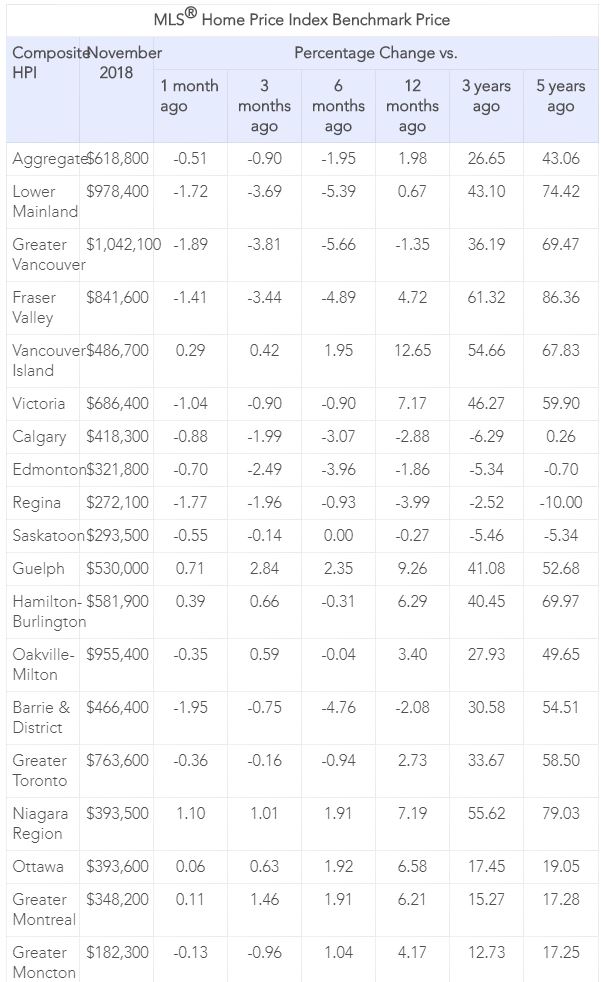
The Aggregate Composite MLS® Home Price Index (MLS® HPI) was up 2.3% y/y in October 2018, down once again on a month-over-month basis.
Following a well-established pattern, condo apartment units posted the largest year-over-year price gains in November (+6%), followed by townhouse/row units (+4%). By comparison, one-storey single-family homes posted a modest increase (+0.4%) while two-storey single-family home prices held steady (+0.1%).
Trends continue to vary widely among the 17 housing markets tracked by the MLS® HPI. In British Columbia, home price gains have been steadily diminishing on a y/y basis in the Fraser Valley (+4.7%) and Victoria (+7.2%). By contrast, price gains picked up elsewhere on Vancouver Island (+12.6%) and, for the first time in five years, were down (-1.4%) from year-ago levels in the GVA. On a month-over-month basis, prices fell 1.9% in Greater Vancouver in November, the most since 2008, adding to the recent series of price declines in Canada’s most expensive housing market.
Among housing markets tracked by the index in the Greater Golden Horseshoe region, MLS® HPI benchmark home prices were up from year-ago levels in Guelph (+9.3%), the Niagara Region (+7.2%), Hamilton-Burlington (+6.3%), Oakville-Milton (+3.4%) and the GTA (+2.7%). Meanwhile, home prices in Barrie and District remain below year-ago levels (-2.1%).
Across the Prairies, benchmark home prices remained below year-ago levels in Calgary (-2.9%), Edmonton (-1.9%), Regina (-4%) and Saskatoon (-0.3%). Excess supply of listings relative to demand will continue to put downward pressure on prices until economic activity in the region strengthens.
In contrast, home prices rose 6.6% y/y in Ottawa (led by a 7.3% increase in two-storey single-family home prices), 6.2% in Greater Montreal (driven by a 9.4% increase in townhouse/row unit prices) and 4.2% in Greater Moncton (led by an 11.2% increase in townhouse/row unit prices). (Table 1)
The actual (not seasonally adjusted) national average price for homes sold in November 2018 was just over $488,000, down 2.9% from the same month last year.
Sales in Greater Vancouver and the GTA, two of Canada’s most active and expensive markets, bias upward heavily skew the national average price. Excluding these two markets from calculations cuts almost $110,000 from the national average price, trimming it to just over $378,000.
Bottom Line
We are likely in store for a prolonged period of modest housing gains in the Greater Golden Horseshoe, stability or softening in British Columbia and further weakening in the Prairies, Alberta, and Newfoundland & Labrador.
The Canadian housing market has slowed considerably since mid-2017 and is ending the year on a quiet note. Two offsetting forces are impacting housing—strong population growth and rising rates. Sluggish sales and modestly rising prices nationally are likely in store for 2019. While there will still be some significant regional divergences, there is no need for further policy actions to affect demand.